Users can define cross-visual interactions in order to pass values from one visual to another, via cross-filtering, or to highlight values across 2 or more visuals, via cross-highlighting.
There are a few methods for configuring cross-visual interactions:
- Draw interactions between visuals on the same slide.
- Use a target to create an interaction from one visualization to another visual on a different slide.
- Define interactions between visuals from the Interaction Manager.
Visuals that share an interaction of the type Data Interaction or Sync can be cross-filtered via a single click on a data point. If the visuals share a highlight interaction, a single click will result in a cross-highlighting effect, although there are circumstances in which cross-filtering will be applied instead.
Interaction Types
There are 3 interaction types available for cross-visual interactions: data interaction, sync, and highlight.
Data Interaction
Data Interactions enable cross-filtering between visuals by a single data point as the default function when clicking on a data point.
Data Interactions also expose the 'Interact' function from the context menu in runtime. Using the Interact function, you can cross-filter by multiple data points using the Lasso Selection and Auto Lasso Selection tools.
In this example, the Lasso Selection tool was used to cross-filter by three member elements:
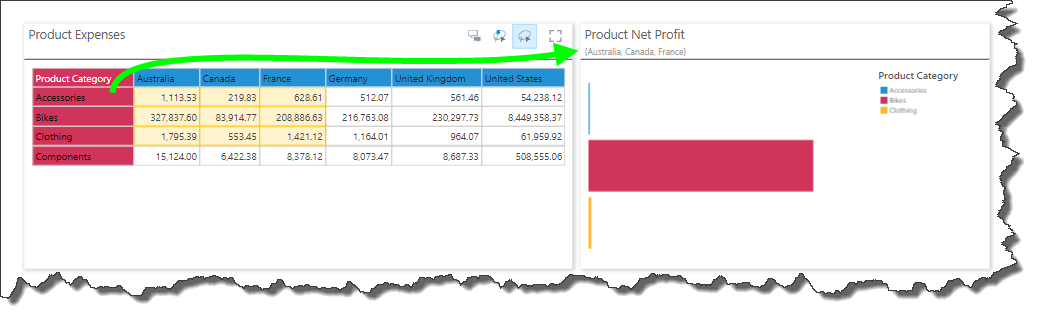
The screen capture below shows single-select and multi-select cross-filtering between 2 visuals sharing a data interaction:
Sync
Sync interactions create synchronization between the 2 selected visualizations. In addition to cross-filtering by single and multiple data points, this also produces a synchronization of various functions that are used to change and manipulate the query at runtime. If both of the visuals share a common hierarchy, than changes made to that hierarchy from one visual will also be applied to the other visual. For example, if you drill-down on a hierarchy that exists in both of the synced visuals, the drill-down function will be applied to each visual.
The screen capture below shows synchronization between 2 visuals:
Highlight
Highlight interactions enable cross-highlighting between the given visuals as the default function when clicking on a data point. If the selected data point or member element exists in both visuals, a highlighting effect will be applied. If the data point or member doesn't exist in the target visual, it will be cross-filtered.
You can use the Lasso tools to cross-highlight by multiple data points.
Cross highlighting is the default interaction type that’s applied whenever an interaction is added between data discoveries; in edit mode, they are designated by a blue interaction arrow, rather than orange (which represents data or sync interactions).

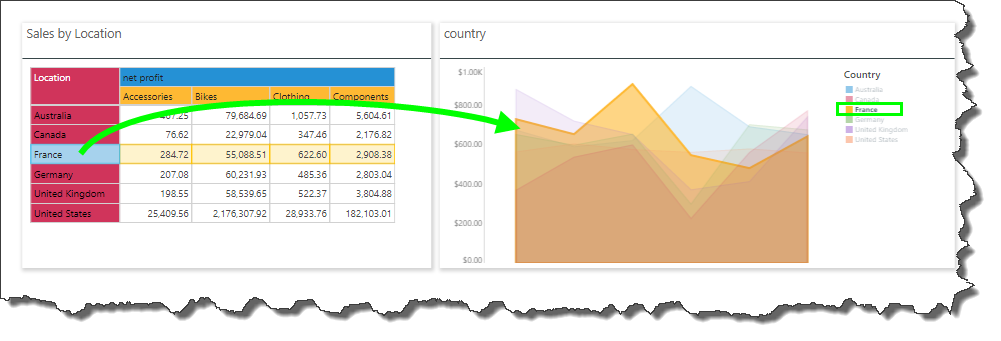
In this example, both visuals contain the member element 'France,'; selecting this element in one of the visuals applies cross-highlighting to both.
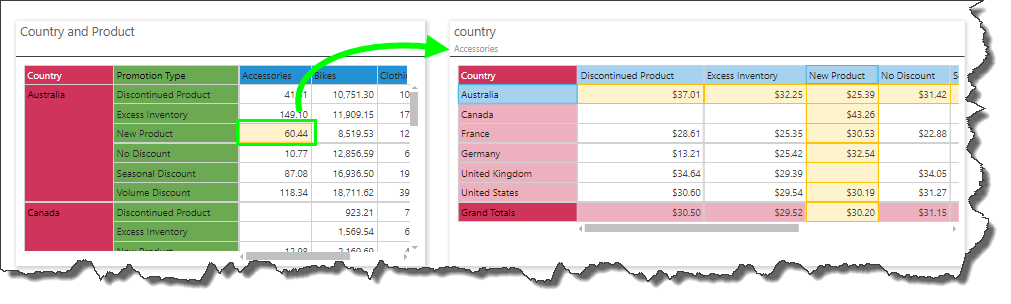
In this example, the data point Australia, New Product, Accessories was selected from the grid on the left (green highlight below). The grid on the right contains the member elements Australia and New Product, which are highlighted in yellow. It does not contain the member element Accessories, which is therefore applied to the grid as a filter, as seen in the breadcrumb trail (green arrow).
Multi-Highlight Mode
Enable multi-highlight mode to click select multiple member elements by which to cross highlight. There are 3 ways to enable or disable multi-highlight mode:
- From the Runtime Settings dialog
- From the context menu in runtime when right clicking on the top panel of a visual or on the slide background
- From the Presentation Menu in runtime
Once enabled, simply click select the elements by which to cross highlight. To clear the selection, click on the visualization's background.
In this example, multi-highlight mode was enabled. Three members was selected from the grid to cross highlight the other visuals, then both the members in the doughnut chart were used to cross highlight the other visuals. Lastly, multi-highlight mode was disabled.
Model Mapping
In order to utilize interactions between visuals, the hierarchy that is being used to filter or hierarchy must be labeled identically in each visual's data source. If both visuals were created from the same data model, this won't require any additional configuration. However, there may be instances where each visual queries a different data model, and the relevant hierarchy and/ or its member elements are not labeled identically in each of those data models. For example, 2 date hierarchies may have different date formatting applied to them. In this scenario, you can configure a cross-model mapping in order to map the corresponding hierarchies to each other; then they can be used in cross-filtering and highlighting, despite the different labeling conventions.
Remove Cross-Visual Interactions in Runtime
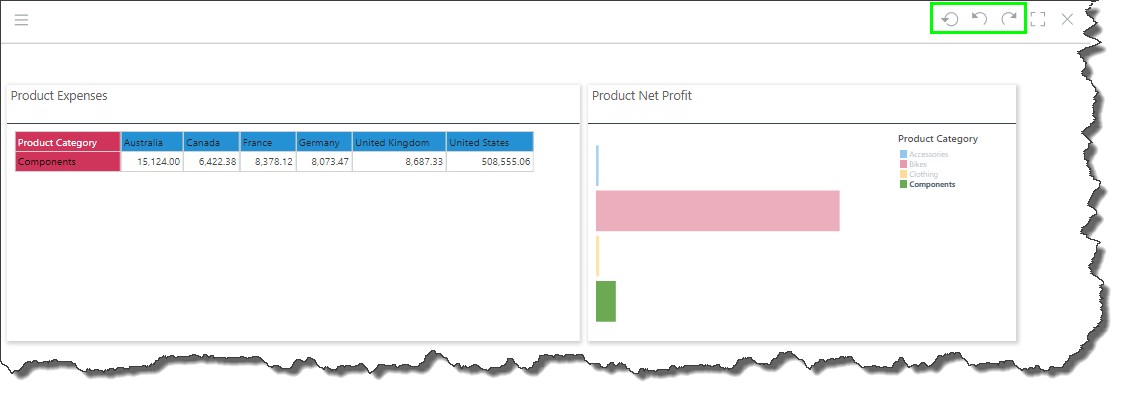
To remove interaction filters and highlighting selections, simply click anywhere on one of the given the visuals, or use the undo and reset buttons (green highlight below).